Realizing The Popularity of WSPR
April 2026
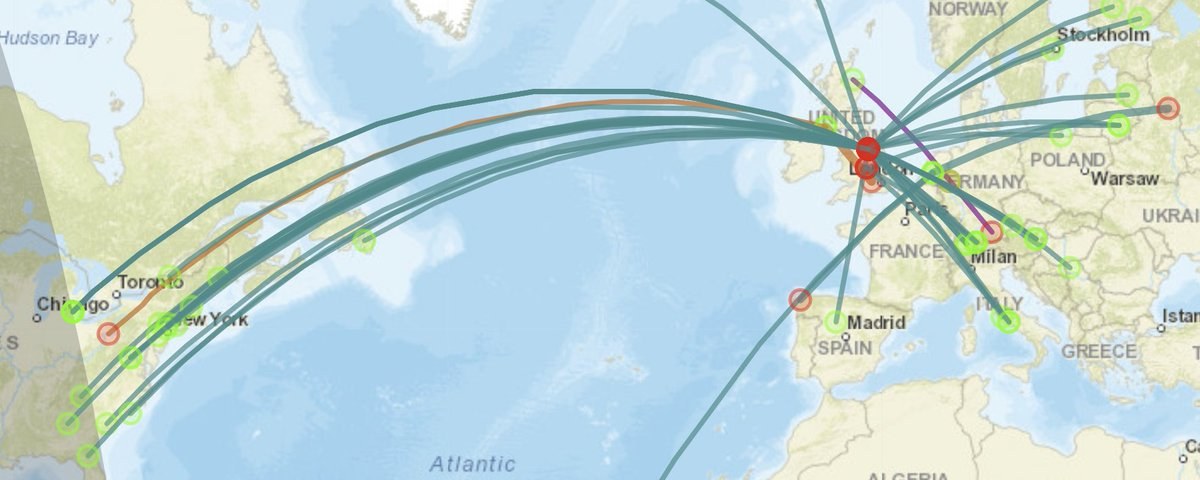
From 300 stations to thousands over the course of 18 years …
Now logging ~ 6 million spots per day. More active than ever!
WSPR (Weak Signal Propagation Reporter) started in 2008. It was designed and initially programmed by Nobel Prize-winning physicist and ham radio operator Joe Taylor, K1JT (Princeton professor).
The idea originated as a suggestion from Murray ZL1BPU for a low-power propagation beacon mode (originally called MEPT-JT, for Manned Experimental Propagation Transmitter). Joe took it up, refined the protocol, and released the first version in April 2008 (announced around March 13, 2008). The software and protocol were later made open-source (GPL) and are now maintained by a small team. Bruce Walker, W1BW, created and maintained the original WSPRnet central database and website for uploading and mapping spots.
How’s it going now? Extremely well — WSPR is more popular and active than ever. It remains a go-to tool for serious propagation studies, antenna testing, low-power (QRP) experiments, and even simple beacon transmitters (many hams use cheap Raspberry Pi or QCX-based beacons). The mode’s incredible sensitivity (down to –28 dB SNR) lets it probe paths that other modes can’t, and stations upload spots to central databases in real time.
Station activity comparison (beginning vs. now):
Early days (2008–2010): Roughly 300–500 stations active worldwide at any one time, generating 50,000–100,000 spots per day. By August 2010 the entire database held about 32 million spots.
Today (2026): The WSPR database contains over 2.73 billion spots total. Recent 24-hour snapshots show ~6 million spots per day (roughly 283,000 spots per hour). Active transmitting stations are in the thousands (one recent dashboard reading showed ~5,500 active transmitters in the timeframe). Receiving stations are also in the high hundreds to low thousands.
That’s orders of magnitude more data than in the early years — clear evidence of massive growth in participation.
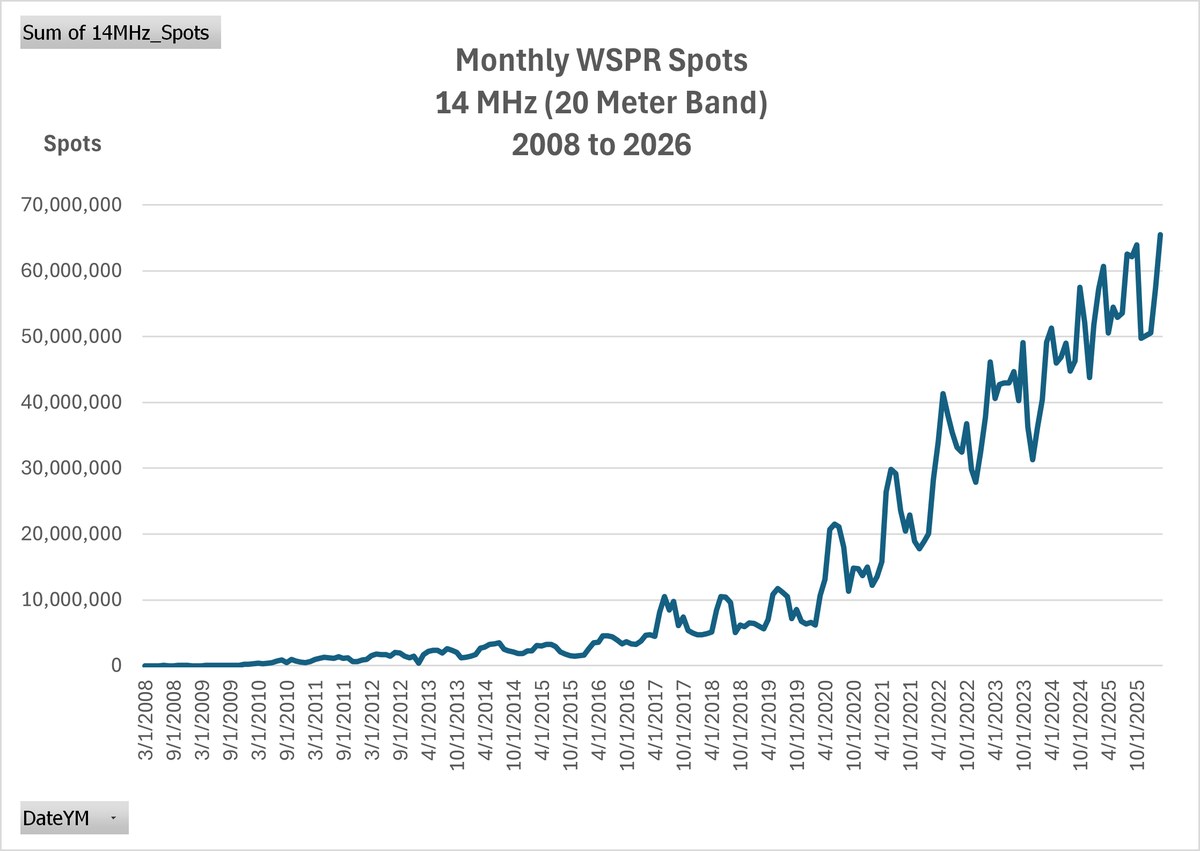
Are there any signs of it slowing down? None.
Activity levels have grown dramatically since 2008. Digital weak-signal modes (WSPR, FT8, etc.) continue to explode in popularity across amateur radio, especially on HF and low bands. WSPR is still heavily used for real-time propagation mapping, noise monitoring, and beaconing. New tools like wspr.live (a full historical database with Grafana dashboards), wspr.rocks (top-spotter leaderboards, maps, etc.), and integration into modern rigs keep it fresh. Recent ham discussions and activity reports show steady or increasing use, particularly on 40 m, 20 m, and LF/MF bands. No decline is visible in spot volume or participation.
WSPR Resources …
Live map & spots: wsprnet.org
Full database + Grafana dashboards: https://wspr.live/ (great for screenshots of current station counts and 24 h trends)
Top spotters, charts, and data tools: https://wspr.rocks/
WSPR has evolved from a niche experiment into one of ham radio’s most successful citizen-science tools — and it’s still growing strong 18 years later.
Verify you're not a bot to load comments: